The city of Beaverton has had a valuable resource for interactively tracking crime around the city and your neighborhood.
For many years, the city of Beaverton posted a crime rate heat map of crime within the city limits. It was, for the most part, a simple image which showed various 'heat' sources where crime was the highest. With this, you could tell at a glance where are the highest crime areas in the city of Beaverton (the only real hot zone at the time was along Lombard between Allen and Denney rd). This has been replaced with something much, much better. Here is a quick look.
Go the Beaverton Police website > Crime Information > Crime Maps & Statistics > and select Crime Maps. This will take you to the default map for Beaverton.

Seems a bit too quiet in Beaverton except for some partying down on Farmington. On the right side of the screen, from the pop out panel, select Zoom to Incidents. This will center your screen on Beaverton.
Look on the left side of the screen to find the Filter button.
Click the Filter button to display the Filter Panel, then select the option Past Six Months. The map will automatically update. Scroll or zoom in the map for a bit more detail.

Now you see criminal activity appearing all over the map.
Don't Worry: Data is Happening
Clicking around the interactive map brings up something that confused me at first: a warning that no data is being collected.
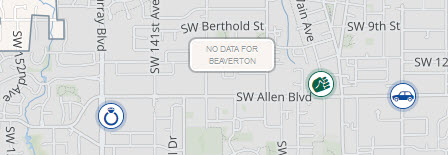
Washington County is listed as an actual reporting entity and this seems to be linked to being a featured property. I recently asked the Police Liaison Jimmy Ho at the South Beaverton NAC meeting on September 19, 2019 about this, because the map definitely indicates some criminal activity, which at first we thought might be data collected from Washington County. But the map is definitely collecting data from the city of Beaverton as I confirmed with Police Liaison Jeremy Shaw.
It is also interesting to note that many roads within perceived city limits are in fact, maintained by Washington County and not Beaverton. For example, on the map above, Murray Blvd is maintained by Washington County.
If you noticed the Map View button on the lower right corner, you can see that you can switch between map modes, much like on Google Maps Switch over the Satellite View.
But what about those circles with numbers in them? Move over to around Fred Meyer's and use your scroll wheel to move in until you see that number over Fred Meyer's. Now click on that circle.

What you can do is actually drill down to each incident reported there. If you left the filter the same, it will display a six month report. Don't be dismayed by the amount of crime happening at Fred Meyer's. That is over the course of six months.
Where are the Sex Offenders?
Crimereports.com does collect this information but it also demands indemnification. Go back to the Filter and you can find a checkbox to display sex offenders. If you do that, you will see a dialog box.
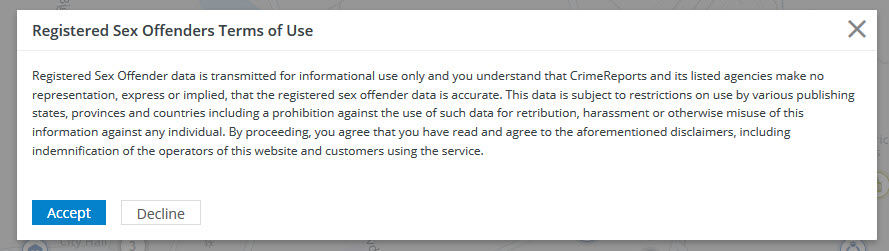
So then you know. You shouldn't rely on this to any extent since this relies on sex offenders actually supplying their location information.
Explore Criminal Oregon
Click around town and then look outside of Beaverton and you can see how it stacks up compared to other cities.
An anonymous source told me though that the criminal data that seems to be collected for the city of Portland is shamefully under-reported. Are you surprised?
Enjoy this tool! I believe the Beaverton police will also soon be offering more information about this valuable tool.
Other Resources for Criminal Activity in Beaverton
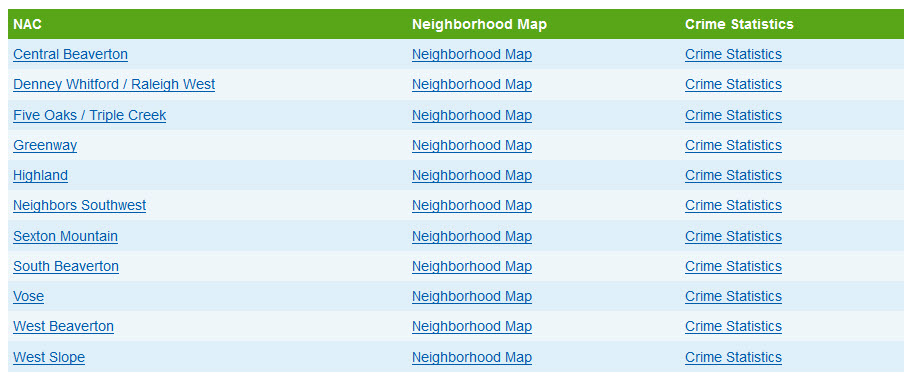
Not quite as exciting as the crime map, you can also get numerous monthly reports. You can download a monthly PDF report of crime by neighborhood from the Beaverton website. There is also city wide information.